
Introduction
When it comes to storing data for businesses, iSCSI has been a go-to solution for its versatility and universal compatibility to work with different systems, big and small. However, iSCSI is an extension of the old storage protocol, that’s why it has limitations (in terms of latency, performance, CPU overhead) that become even clearer with modern storage such as NVMe. This is where NVMe over Fabrics (NVMe-oF) comes in, offering a way to address iSCSI’s weak points and bring about much faster and more efficient storage solutions. NVMe-oF extends the capabilities of NVMe (Non-Volatile Memory Express) across networks, promising to revolutionize storage systems with better performance and scalability for today’s data-heavy tasks.
While iSCSI is adaptable, it struggles with speed and efficiency in demanding environments. NVMe-oF offers a compelling alternative by using NVMe technology to provide faster access to data with lower delays. By using technologies like RDMA (Remote Direct Memory Access) or TCP/IP networks, NVMe-oF removes the roadblocks that slow down traditional iSCSI setups, making it a smart choice for businesses needing high-performance storage.
Purpose
So, why are we here? This evaluation aims to thoroughly understand how well the Linux Storage Performance Development Kit (SPDK) iSCSI Target performs in high-performance storage scenarios. By carefully testing and analyzing its strengths and weaknesses, we hope to offer valuable insights for technical decision-makers striving to make their storage systems work as fast as possible.
Additionally, we want to compare the SPDK iSCSI target with SPDK NVMe-oF to see how they stack up against each other in terms of speed, efficiency, and suitability for different tasks. Our goal is to help businesses make informed decisions about their storage setups, so they can pick the right technology to meet their needs and goals.
Methodology
In our benchmarking we employ fio, a flexible I/O tester, to conduct various test patterns including random and sequential read/write operations at different block sizes. The tests were executed both locally and remotely over iSCSI for measuring SPDK iSCSI target performance.
The following patterns have been used during the benchmark:
- Random read/write operations at 4k and 64k block sizes.
- Sequential read/write at 1M block size.
In our article, we provide the specific test parameters that we have identified to have the best performance-to-latency ratio in our set of tests.
In real-world production, we have to work with devices that are in the kernel space and cannot be captured by SPDK in user space (software RAID, hardware RAID, fault tolerance in any form), so we use the AIO module to test scenarios that are closest to production.
We understand that the AIO module has its own overhead, and with its use, we get lower performance than if we had captured NVMe in user space.
Testbed configuration
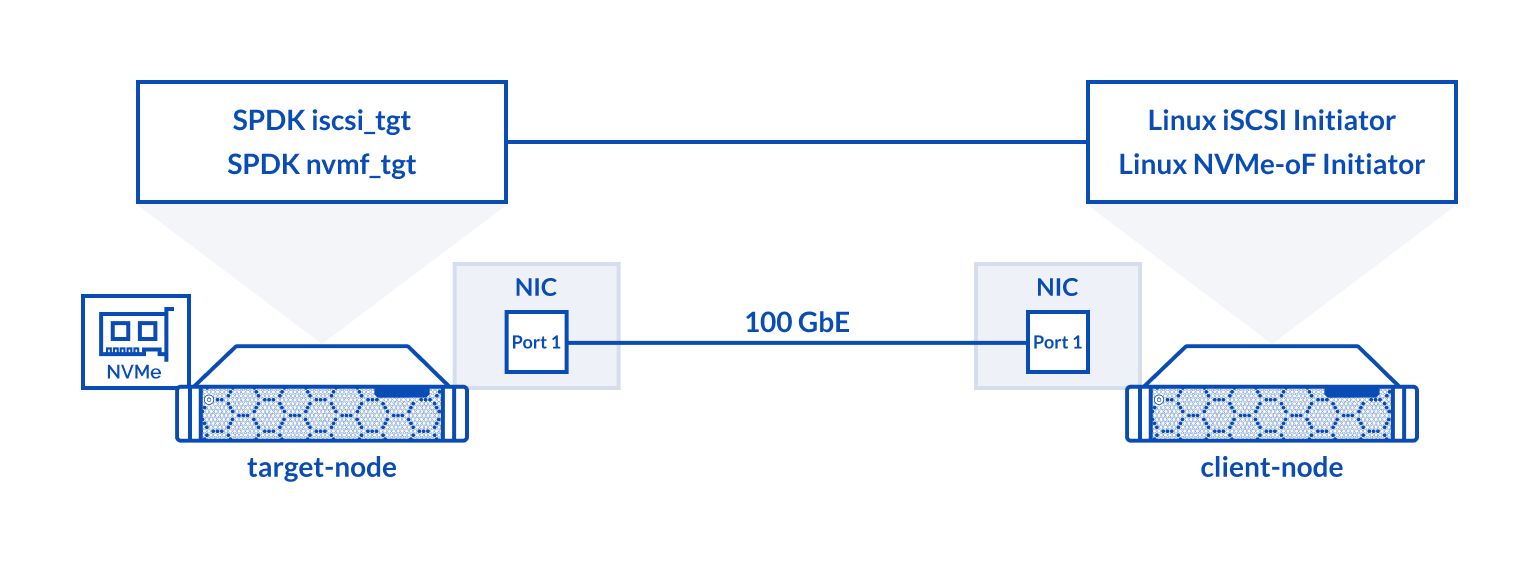
The testbed for this benchmarking involved two Supermicro nodes with high-performance hardware, equipped with Intel® Optane™ SSDs and ConnectX®-5 EN 100GbE NICs.
Architecture overview
Target Node
Hardware
| Target node | Supermicro (SYS-220U-TNR) |
|---|---|
| CPU | Intel(R) Xeon(R) Platinum 8352Y @2.2GHz |
| Sockets | 2 |
| Cores/Threads | 64/128 |
| RAM | 256Gb |
| Storage | 1x Intel® Optane™ SSD DC P5800X Series (400GB) |
| NICs | 1x ConnectX®-5 EN 100GbE (MCX516A-CDAT) |
Software
| OS | Ubuntu 20.04.6 (5.15.0-91-generic) |
|---|---|
| SPDK | v23.05 |
| fio | 3.16 |
Client Node
Hardware
| Client node | Supermicro (2029UZ-TR4+) |
|---|---|
| CPU | 2x Intel® Xeon® Platinum 8268 Processor @ 2.90GHz |
| Sockets | 2 |
| Cores/Threads | 48/96 |
| RAM | 96Gb |
| NIC | 1x ConnectX®-5 EN 100GbE (MCX516A-CDAT) |
Software
| OS | Ubuntu 20.04.6 (5.4.0-155-generic) |
|---|---|
| fio | 3.16 |
| nvme-cli | 1.9 |
Benchmark results
To start, below are the benchmarking results that compare the baseline performance of a local NVMe device with that of a remote Linux SPDK iSCSI target across a range of block sizes.
Local NVMe vs SPDK iSCSI Target
| Linux (local) 1x Intel® Optane™ SSD DC P5800X Series (400GB) |
Linux iSCSI initiator (remote) 1x Intel® Optane™ SSD DC P5800X Series (400GB) via AIO 6x LUNs (6 logical volumes), multipathd enabled 4x sessions per LUN |
Comparison % | ||||||||||||||
|---|---|---|---|---|---|---|---|---|---|---|---|---|---|---|---|---|
| Pattern | Numjobs | IOdepth | IOPs | MiB\s | Latency (ms) | CPU usage | ||||||||||
| Random read 4k | 6 | 4 | 1552000 | 6061 | 0.015 | 4% | 32 | 32 | 1272000 | 4969 | 0.806 | 47% | 82% | 82% | 5370% | 1175% |
| Random write 4k | 6 | 4 | 1160000 | 4532 | 0.020 | 3% | 32 | 32 | 1130000 | 4414 | 0.906 | 42% | 97% | 97% | 4528% | 1400% |
| Random read 64K | 2 | 2 | 109000 | 6799 | 0.036 | 1% | 6 | 8 | 111000 | 6946 | 0.431 | 4% | 102% | 102% | 1197% | 400% |
| Random write 64K | 2 | 2 | 75500 | 4717 | 0.052 | 1% | 6 | 8 | 74700 | 4670 | 0.641 | 4% | 99% | 99% | 1233% | 400% |
| Sequential read 1M | 1 | 2 | 7034 | 7034 | 0.284 | 1% | 3 | 2 | 6877 | 6877 | 0.871 | 1% | 98% | 98% | 307% | 100% |
| Sequential write 1M | 1 | 2 | 4790 | 4790 | 0.417 | 1% | 3 | 2 | 4553 | 4553 | 1.316 | 1% | 95% | 95% | 316% | 100% |
Now, let’s get straight to the point – analyze the initial benchmarking results. We find that local NVMe storage delivers strong baseline performance for random 4K reads and writes, hitting up to 1.55 million IOPS. The SPDK iSCSI target achieves 82% of this local storage performance, with 1.33 million IOPS. However, for larger block size reads/writes, the performance of local storage and the SPDK iSCSI target is nearly identical.
Digging deeper into latency, we observe that the baseline latency for local storage on 4K reads and writes is 0.015 ms and 0.020 ms, respectively. In contrast, the SPDK iSCSI target’s 4K read and write latency is about 50 times higher than that of local NVMe, at 0.806 ms and 0.906 ms respectively, due to the extra CPU overhead introduced by the iSCSI protocol.
CPU utilization for the SPDK iSCSI target is considerably higher than for local NVMe because the SPDK target software must process each iSCSI command, and more IOPS translates to a greater CPU load. During local storage tests, CPU usage ranged from 1% for 1M block sizes to 4% for 4K writes, whereas the SPDK iSCSI target demonstrated significantly higher CPU usage, from 1% for 1M blocks to 47% for 4K writes.
In conclusion, the SPDK iSCSI implementation offers good overall performance but at the cost of CPU performance on smaller block sizes (4k RR/RW), showing a substantially higher CPU load and I/O latency.
SPDK iSCSI vs SPDK NVMe-oF
Let’s now compare the performance of SPDK NVMe-oF and SPDK iSCSI targets.
Below are tables and graphs displaying test results for various block sizes, highlighting parameters like IOPS, latency, CPU usage, and bandwidth. Beneath each image is a detailed analysis evaluating the efficiency of NVMe-oF over RDMA, NVMe-oF over TCP, and iSCSI.
SPDK iSCSI Target results
| Linux iSCSI initiator (remote) 1x Intel® Optane™ SSD DC P5800X Series (400GB) via AIO 6x LUNs (6 logical volumes), multipathd enabled 4x sessions per LUN |
||||||
|---|---|---|---|---|---|---|
| Pattern | Numjobs | IOdepth | IOPs | MiB\s | Latency (ms) | CPU usage |
| Random read 4k | 1 | 1 | 22600 | 88 | 0.043 | 1% |
| Random write 4k | 1 | 1 | 8716 | 34 | 0.113 | 1% |
| Random read 4k | 32 | 32 | 1272000 | 4969 | 0.806 | 47% |
| Random write 4k | 32 | 32 | 1130000 | 4414 | 0.906 | 42% |
| Random read 64K | 6 | 8 | 111000 | 6946 | 0.431 | 4% |
| Random write 64K | 6 | 8 | 74700 | 4670 | 0.641 | 4% |
| Sequential read 1M | 3 | 2 | 6877 | 6877 | 0.871 | 1% |
| Sequential write 1M | 3 | 2 | 4553 | 4553 | 1.316 | 1% |
SPDK NVMe-oF target over RDMA results
| Linux NVMe-oF Initiator (remote, RDMA) 1x Intel® Optane™ SSD DC P5800X Series (400GB) via AIO |
||||||
|---|---|---|---|---|---|---|
| Pattern | Numjobs | IOdepth | IOPs | MiB\s | Latency (ms) | CPU usage |
| Random read 4k | 1 | 1 | 51100 | 200 | 0.018 | 1% |
| Random write 4k | 1 | 1 | 28000 | 113 | 0.033 | 1% |
| Random read 4k | 8 | 16 | 1558000 | 6085 | 0.082 | 7% |
| Random write 4k | 8 | 8 | 1143000 | 4467 | 0.055 | 5% |
| Random read 64K | 3 | 2 | 108000 | 6755 | 0.055 | 1% |
| Random write 64K | 3 | 2 | 74800 | 4677 | 0.079 | 1% |
| Sequential read 1M | 1 | 2 | 7033 | 7033 | 0.283 | 1% |
| Sequential write 1M | 1 | 2 | 4786 | 4786 | 0.417 | 1% |
SPDK NVMe-oF target over TCP results
| Linux NVMe-oF Initiator (remote, TCP) 1x Intel® Optane™ SSD DC P5800X Series (400GB) via AIO |
||||||
|---|---|---|---|---|---|---|
| Pattern | Numjobs | IOdepth | IOPs | MiB\s | Latency (ms) | CPU usage |
| Random read 4k | 1 | 1 | 28600 | 112 | 0.034 | 1% |
| Random write 4k | 1 | 1 | 15500 | 61 | 0.063 | 1% |
| Random read 4k | 18 | 32 | 1503000 | 5871 | 0.382 | 19% |
| Random write 4k | 18 | 16 | 1102000 | 4305 | 0.26 | 12% |
| Random read 64K | 6 | 4 | 109000 | 6812 | 0.219 | 4% |
| Random write 64K | 6 | 4 | 75700 | 4730 | 0.316 | 3% |
| Sequential read 1M | 3 | 2 | 6756 | 6756 | 0.886 | 1% |
| Sequential write 1M | 3 | 2 | 4540 | 4540 | 1.32 | 1% |
Visualizing results in charts
With all benchmarks completed and data collected, let’s now compare the achieved results using graphical charts for a clearer understanding.
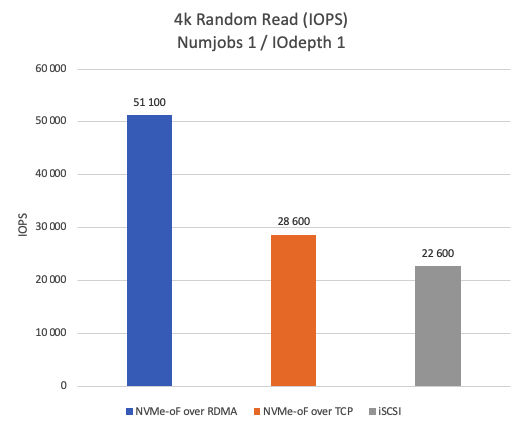
Figure 1 shows the number of Input/Output Operations Per Second (IOPS) achieved during 4K random read operations with Numjobs = 1 and IOdepth = 1. It reveals that NVMe-oF over RDMA significantly outperforms both NVMe-oF over TCP (by 44%) and iSCSI (by 55.77%) in terms of IOPS in the single-thread scenario.
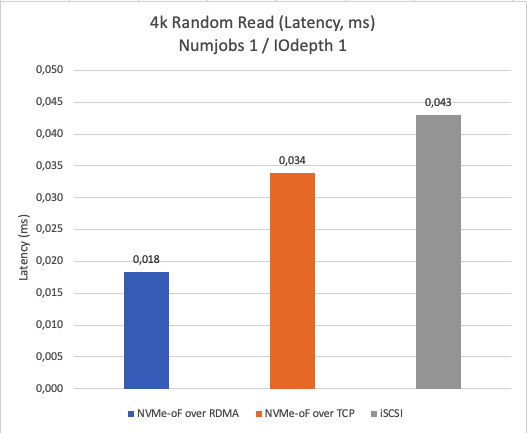
Figure 2 compares the latency when reading 4K data blocks with a single thread. The results indicate that NVMe-oF over RDMA has the lowest latency, followed by NVMe-oF over TCP, and then iSCSI.
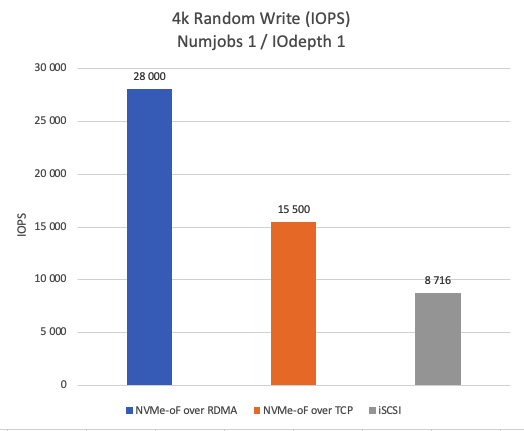
Figure 3 shows the IOPS achieved with a 4K random write pattern. The test reveals that NVMe-oF over RDMA outperforms NVMe-oF over TCP by 44.64% and iSCSI by 68.87% in terms of IOPS in the single-thread scenario.
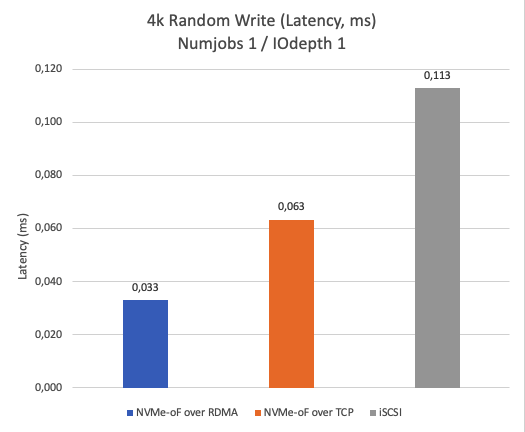
Figure 4 showcases the latency results for a 4K block size. The test findings indicate that NVMe-oF over RDMA delivers the lowest latency in single-thread scenarios, outperforming both NVMe-oF over TCP and iSCSI. Clearly, lower latency is better.
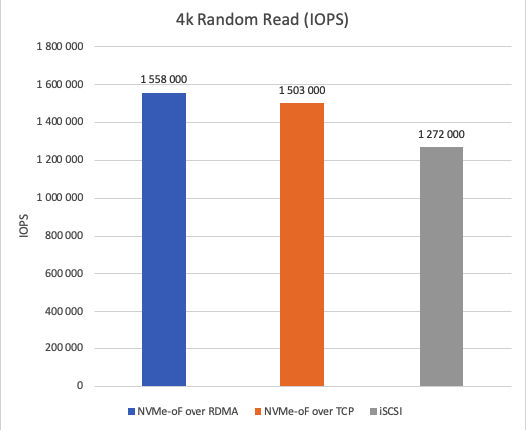
Figure 5 illustrates the IOPS achieved during 4K random read operations. NVMe-oF over RDMA outperforms NVMe-oF over TCP by 3.5% and iSCSI by 18.35% in terms of IOPS.
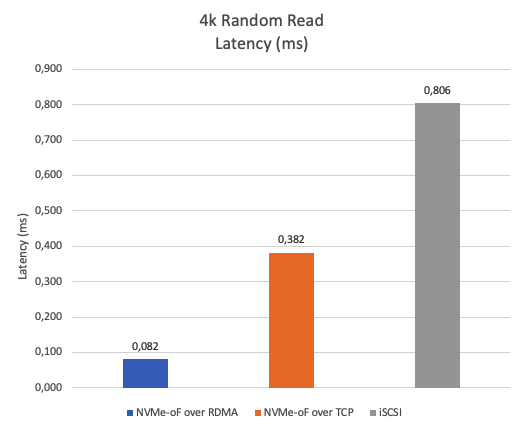
Figure 6 displays the results of a 4K random read latency test using multiple threads. Lower latency indicates better performance. NVMe-oF over RDMA exhibits roughly 78% lower latency compared to NVMe-oF over TCP and about 90% lower latency compared to iSCSI.
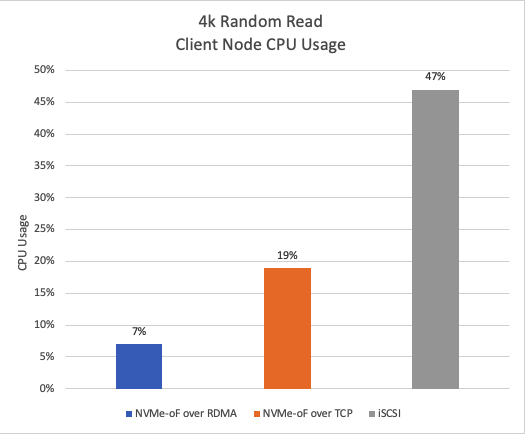
Figure 7 shows the CPU usage during a 4k random read test. NVMe-oF over RDMA exhibits approximately 85% lower CPU usage compared to iSCSI and approximately 63% lower CPU usage compared to NVMe-oF over TCP.
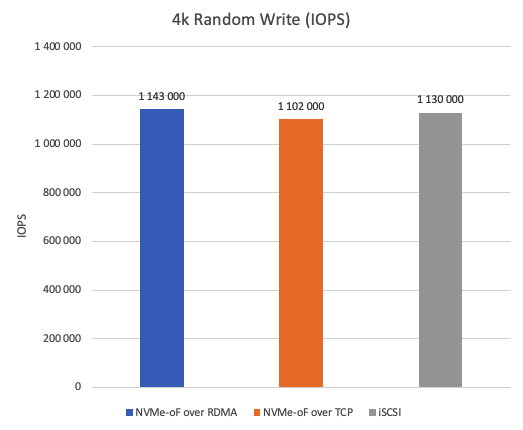
Figure 8 shows IOPS achieved during 4k random write operations. NVMe-oF over RDMA leads with approximately 3% higher IOPS compared to iSCSI and approximately 4% higher IOPS compared to NVMe-oF over TCP.
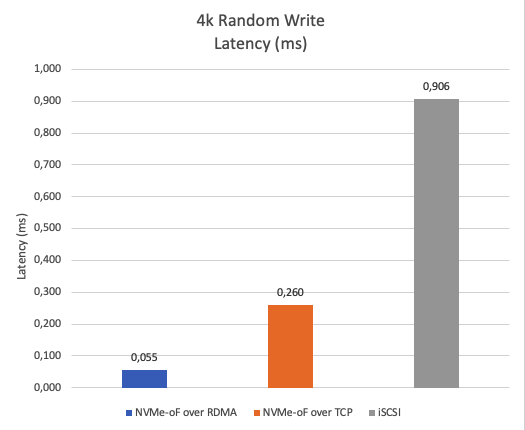
Figure 9 compares the latency for writing 4K data blocks. NVMe-oF over RDMA demonstrates roughly 79% lower latency compared to NVMe-oF over TCP and about 94% lower latency compared to iSCSI, highlighting its superior performance.
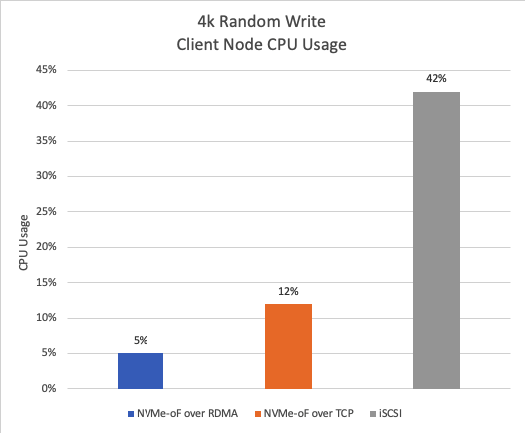
Figure 10 displays CPU usage during a 4k random write test, NVMe-oF over RDMA demonstrates approximately 88% lower CPU usage compared to iSCSI and approximately 58% lower CPU usage compared to NVMe-oF over TCP, highlighting its superb efficiency.
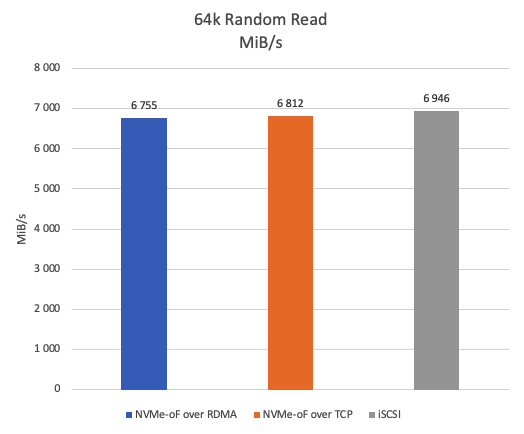
Figure 11 illustrates the throughput for random reads in 64KB blocks. iSCSI achieves approximately 2% higher average read speed than NVMe-oF over TCP, and about 3% higher than NVMe-oF over RDMA.
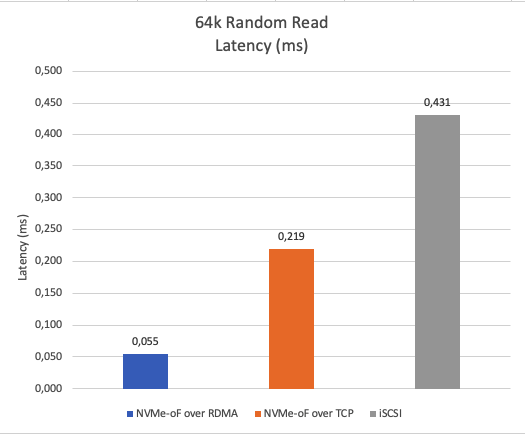
Figure 12 displays latency for a 64K random read. Naturally, NVMe-oF over RDMA exhibits roughly 75% lower latency compared to NVMe-oF over TCP and about 87% lower latency compared to iSCSI.
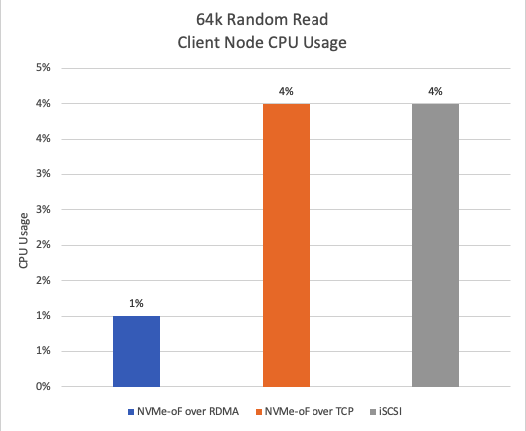
Figure 13 shows CPU usage during a 64k random read. NVMe-oF over RDMA exhibits approximately 75% lower CPU usage compared to iSCSI and NVMe-oF over TCP.
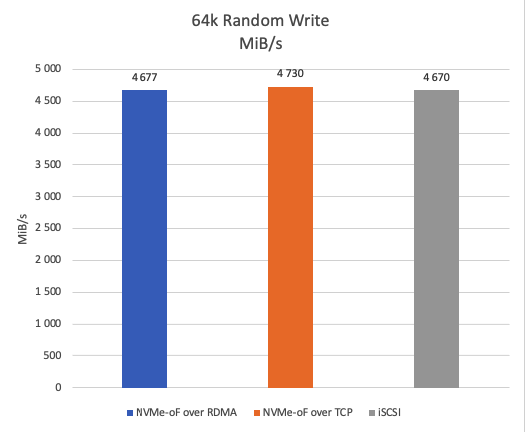
Figure 14 shows the average throughput during a 64k random write test. NVMe-oF over TCP demonstrates approximately 1.2% higher average write speed than both NVMe-oF over RDMA and iSCSI.
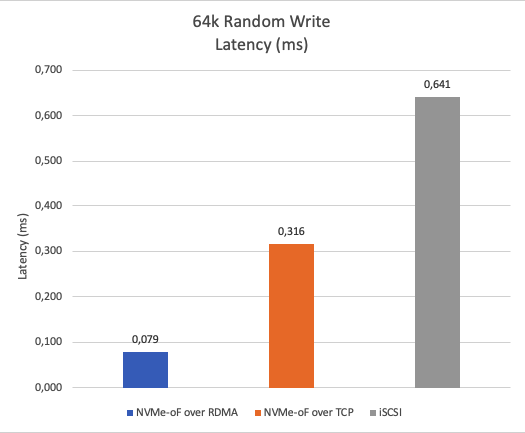
Figure 15 shows the latency of 64k random writes. NVMe-oF over RDMA demonstrates approximately 87.67% lower average latency compared to iSCSI and approximately 75% lower average latency compared to NVMe-oF over TCP. The lower, the better.
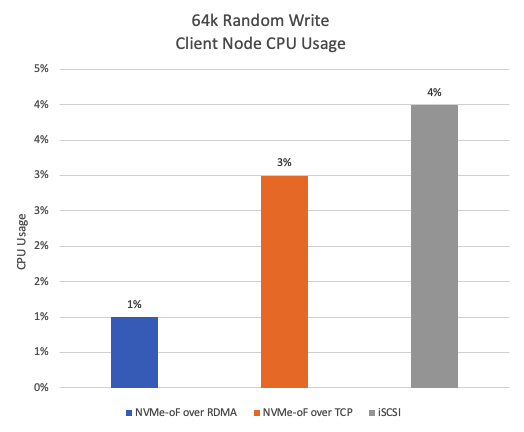
Figure 16 displays CPU usage during 64k random write. NVMe-oF over RDMA exhibits approximately 75% lower CPU usage compared to iSCSI, and approximately 67% lower CPU usage compared to NVMe-oF over TCP.
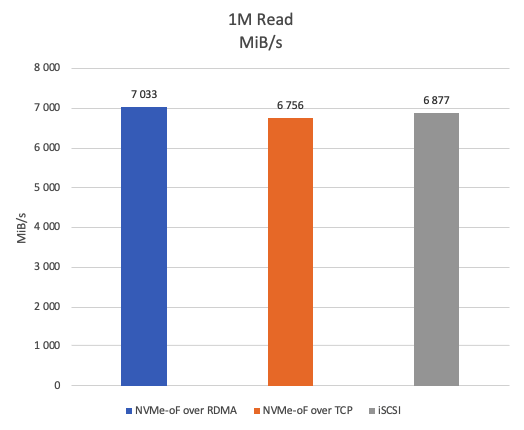
Figure 17 depicts the results of a 1M sequential read test measuring throughput in MiB/s. NVMe-oF over RDMA exhibits approximately 4% higher performance than NVMe-oF over TCP and approximately 2% higher performance than iSCSI.
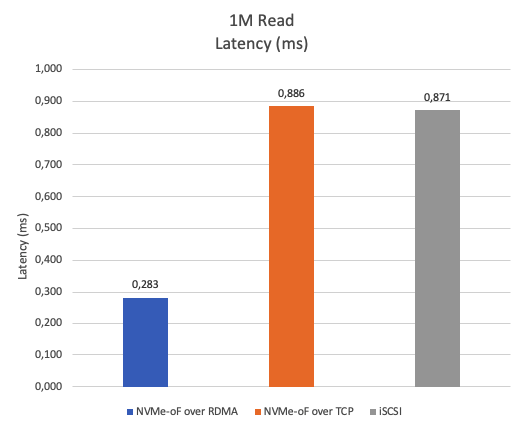
Figure 18 shows the average latency during the 1M sequential read test. NVMe-oF over RDMA demonstrates approximately 66% lower average latency compared to iSCSI and NVMe-oF over TCP.
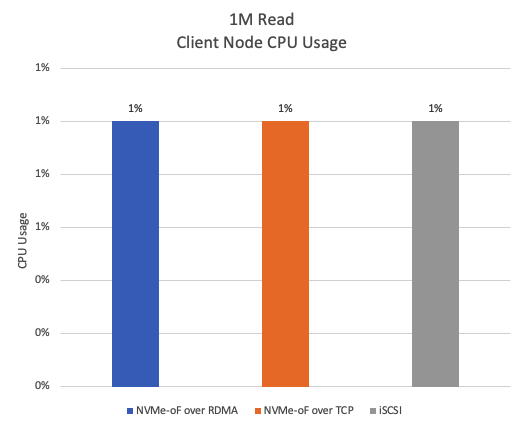
Figure 19 shows that the CPU usage for all three protocols during a 1M read test is relatively low, hovering around 1% for most of the time. This is expected, as less IOPS means less CPU cycles.
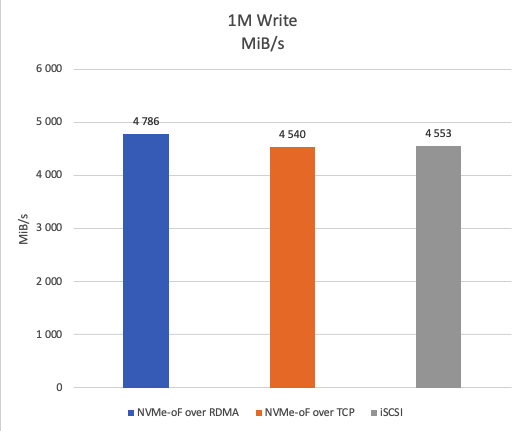
Figure 20 depicts the results of a 1M sequential write test. NVMe-oF over RDMA achieves approximately 5% higher throughput than both NVMe-oF over TCP and iSCSI.
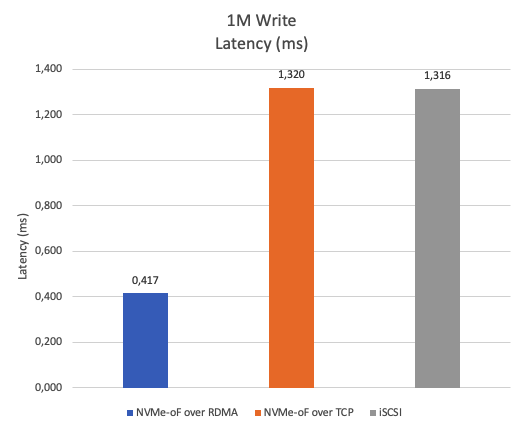
Figure 21 displays the results of a 1M sequential write latency test, NVMe-oF over RDMA demonstrates approximately 68% lower latency compared to NVMe-oF over TCP and iSCSI.
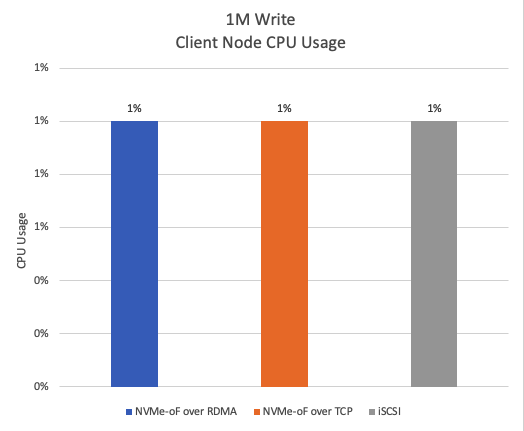
Figure 22 shows that the CPU usage for all three protocols during a 1M write test is very low, hovering around 1% for most of the time.
Conclusion
Based on these test results, we can see that NVMe-oF over RDMA is the clear winner for high-performance storage applications demanding the absolute best speed and efficiency. However, for the best results, it requires RDMA-capable hardware and might be more complex to set up compared to iSCSI. NVMe-oF over TCP offers a good balance between performance and complexity, while iSCSI remains a viable option for more traditional workloads where the lowest possible latency and absolute maximum IOPS are not critical.
So, what’s the verdict? Choosing between iSCSI SPDK and NVMe-oF hinges on your specific priorities. If raw speed, efficiency, and future-proofing are paramount, NVMe-oF takes the lead. For simpler setups and broader compatibility, iSCSI SPDK might be a suitable choice, especially if knowing how to tweak it to get the maximum performance. Ultimately, the ideal solution lies in carefully analyzing your performance needs, infrastructure limitations, and budget constraints to make an informed decision that best suits your high-performance storage requirements.
This material has been prepared in collaboration with Iryna Chaplya, Technical Writer with almost 5 years of experience at StarWind.